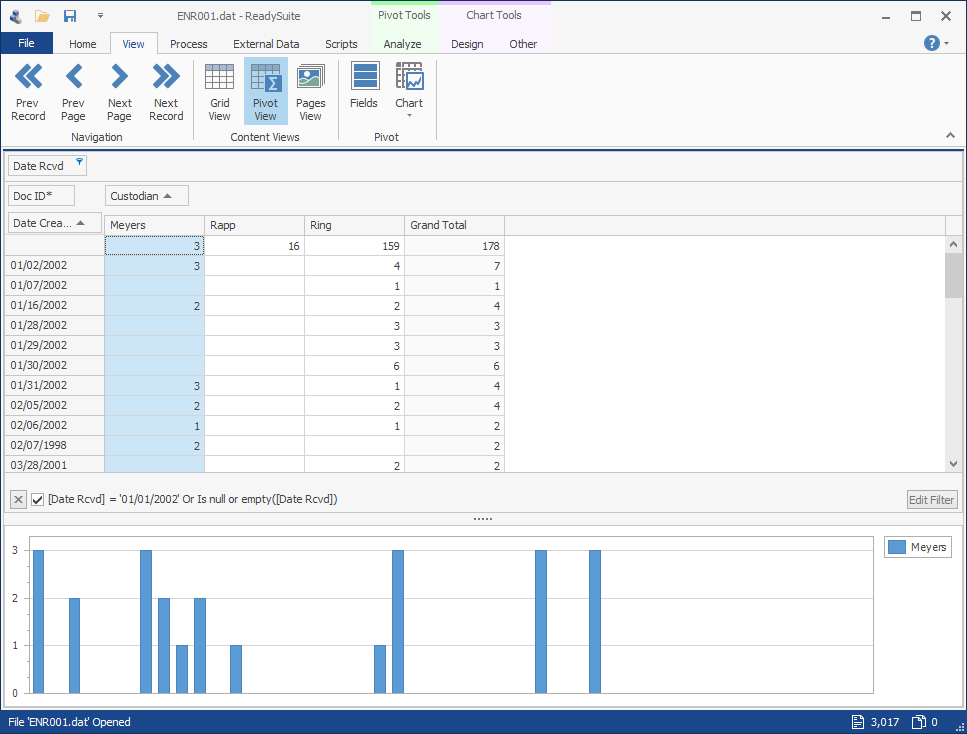
Pivot View Chart
The Pivot View chart displays data selected from the PivotGrid Field List dialog box in a graphical representation. You can choose the type of chart, as well as its color palette and template.
To view Pivot View metrics as a chart
- In the Pivot View, click the row or column you want to view as a chart.
- In the ReadySuite ribbon, click View > Chart to change the view of the Pivot View chart.
- Right: Open the chart panel to the right of the Pivot View.
- Bottom: Open the chart panel to the bottom of the Pivot View.
- Off: Close the chart panel.
To select the type of chart for viewing the Pivot View metrics
- In the ReadySuite ribbon, click Design.
- Use the Chart Type group to select the type of chart you want displayed in the Pivot View chart.
To select the color scheme of the of chart displaying the Pivot View metrics
- In the ReadySuite ribbon, click Design.
- Click Palettte and select the color scheme you want displayed in the Pivot View chart.
To select the color template of the of chart displaying the Pivot View metrics
- In the ReadySuite ribbon, click Design.
- Use the Appearance group to select the color template you want displayed in the Pivot View chart.